Interactive web graphics for R built on plotly.js. plotly.core is a rendering engine for the plotly R package and can also be used stand-alone.
- Faster plots, less browser memory plotly.core leverages advances in plotly.js to improve browser rendering performance, and implements optimizations to on the R backend to cut down plot generation time and size in memory. Rendering large time series plots and heatmaps is 10-100x faster. DateTime optimizations and support for single precision floats allows up to 2x reduction of browser memory. (See the render-performance vignette for more details)
-
Machine-generated code and documentation from the plotly.js schema. All 47 trace types and every layout object have a machine-generated
go_*()constructor (go_scatter(),go_layout_xaxis(), … 979 in total) and comprehensive R documentation of arguments and thorough validation generated from the schema. Future changes to the plotly.js schema can be ported to the R implementation without hand-writing any R code or documentation. -
Full backwards compatibility with the plotly R package. plotly’s
plot_ly()andggplotly()plots are rendered by plotly.core, so existing plotly R code gets the same performance work and plotly.js version. (Working branch: msummersgill/plotly@plotly-core-render) Helper functions in the plotly package back-port functionality for features and behavior deprecated between the last CRAN release plotly.js/2.25.2 and plotly-js/latest -
Shiny, R Markdown, Quarto, and static image export
plotlyOutput()/renderPlotly(),event_data()andplotlyProxy()work as in the plotly R package; figures render inline in documents, as static images in PDF/Word output.save_image()exports PNG, JPEG, WebP, SVG, PDF and EPS with headless Chrome (no Python needed). - Plotly Express Ports of functionality from the plotly.py package introduce high-level methods quickly create figures with minimal code.
Installation
plotly.core has not been submitted to CRAN yet. Install the development version from GitHub with remotes.
# install.packages("remotes")
# plotly.core
remotes::install_github("msummersgill/plotly.R.core")
# plotly with plotly.core rendering
remotes::install_github("msummersgill/plotly@plotly-core-render")
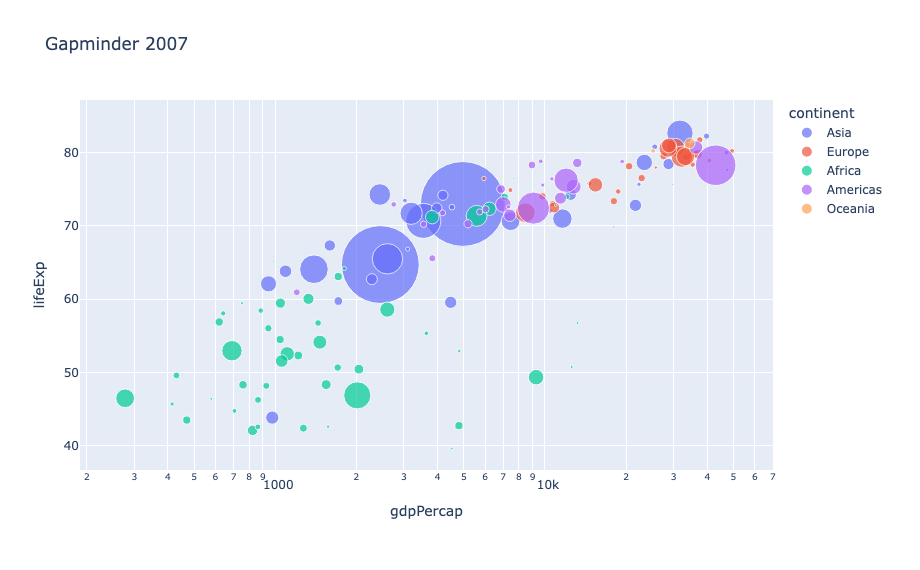
Example: Plotly Express
library(plotly.core)

px_data_gapminder(year = 2007) |>
  px_scatter(
    x = ~gdpPercap, y = ~lifeExp, size = ~pop, color = ~continent,
    hover_name = ~country, log_x = TRUE, size_max = 60, title = "Gapminder 2007"
  )
Example: a 2D scatter plot with graph objects
library(plotly.core)

mtcars |>
  go_figure() |>
  add_scatter(
    x = ~wt,
    y = ~mpg,
    mode = "markers",
    text = rownames(mtcars),
    marker = list(
      size = 12,
      color = ~cyl,
      colorscale = "Viridis",
      showscale = TRUE,
      colorbar = list(title = "Cylinders")
    ),
    hovertemplate = "%{text}<br>Weight: %{x} (1000 lbs)<br>MPG: %{y}<extra></extra>"
  ) |>
  update_layout(title = "Fuel economy vs. weight (mtcars)") |>
  update_xaxes(title_text = "Weight (1000 lbs)") |>
  update_yaxes(title_text = "Miles per gallon")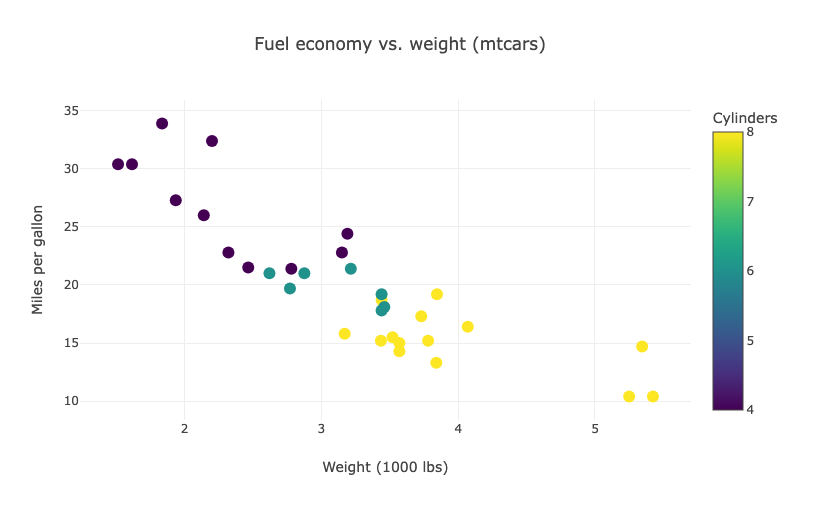
Example: subplots
fig <- make_subplots(
  rows = 2, cols = 2,
  specs = list(
    list(list(secondary_y = TRUE), list(type = "domain")),
    list(list(colspan = 2), NULL)
  ),
  subplot_titles = c("Scatter + secondary y", "Pie", "Bar across both columns")
) |>
  add_scatter(x = mtcars$wt, y = mtcars$mpg, mode = "markers", name = "mpg", row = 1, col = 1) |>
  add_scatter(x = sort(mtcars$wt), y = sort(mtcars$hp), mode = "lines", name = "hp",
              row = 1, col = 1, secondary_y = TRUE) |>
  add_pie(labels = c("4", "6", "8"), values = as.vector(table(mtcars$cyl)), row = 1, col = 2) |>
  add_bar(x = rownames(mtcars), y = mtcars$qsec, name = "qsec", row = 2, col = 1) |>
  update_yaxes(title_text = "hp", row = 1, col = 1, secondary_y = TRUE) |>
  update_layout(showlegend = FALSE)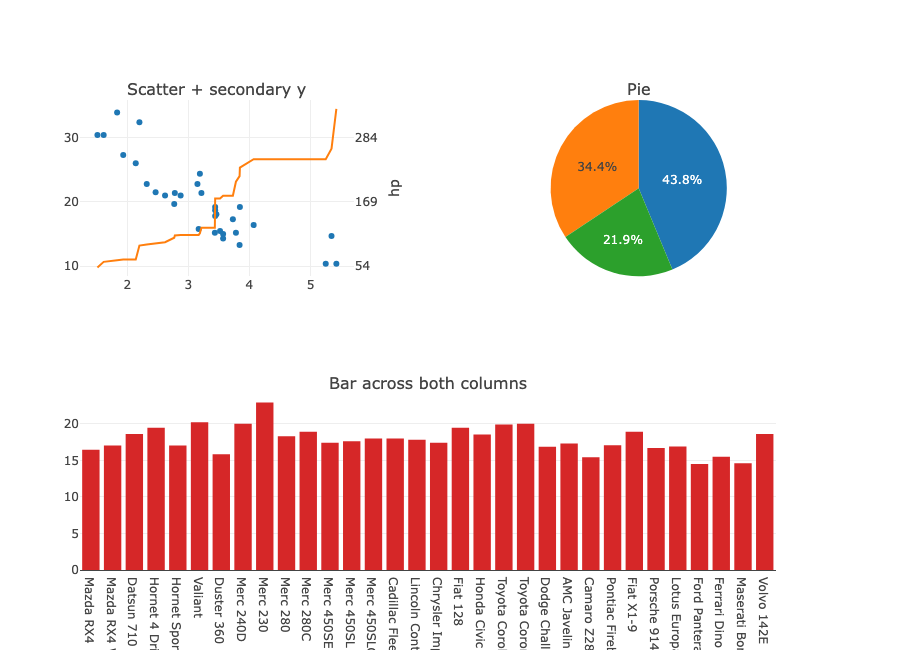
Graph objects and validation
Nested properties can also be written with “magic underscores”, as in plotly.py: marker_size = 12 is the same as marker = list(size = 12). Invalid values are caught immediately:
add_scatter(fig, x = mtcars$wt, y = mtcars$mpg, mode = "dots")
#> Error: Invalid value of type 'character' received for the 'mode' property of scatter
#>     Received value: "dots"
#>
#>     The 'mode' property is a flaglist and may be specified as a string containing:
#>       - Any combination of "lines", "markers", "text" joined with '+' characters (e.g. 'lines+markers')
#>         OR exactly one of "none"
Shiny
library(shiny)
ui <- fluidPage(plotlyOutput("plot"), verbatimTextOutput("click"))
server <- function(input, output, session) {
  output$plot <- renderPlotly(px_data_iris() |> px_scatter(x = ~sepal_width, y = ~sepal_length))
  output$click <- renderPrint(event_data("plotly_click"))
}
shinyApp(ui, server)
plotlyProxy() and plotlyProxyInvoke() update a rendered plot (e.g. "extendTraces", "relayout") without redrawing it.
Static images
# uses headless Chrome via chromote; offers to download Chrome Headless Shell
# if no browser is installed
save_image(fig, "figure.png", width = 800, height = 500, scale = 2)
save_image(fig, "figure.pdf")
save_image(fig, "figure.eps") # needs the rsvg package
In R Markdown and Quarto, figures in PDF or Word output are included as static images automatically when Chrome is available.
Existing plotly R code
The plotly package’s plot_ly(), add_*(), layout(), subplot(), highlight() and ggplotly() are built on plotly.core: plotly converts its plots to plotly.core figures and renders them with plotly.core’s widget. The extension points it uses are S3 generics here (add_trace(), the add_<trace type>() functions, as_widget() and config()), plus get_validator() and set_last_plot().
Development
Code in this repository was generated by an LLM (Claude) directed to follow the directory structure of plotly.py and test support and backwards compatibility with the R plotly package. C code leverages optimizations pioneered in data.table::fwrite/data.table::fread. Authors of the “inspiration” code are included as contributors to this package as such.
Code generation follows plotly.py’s commands.py and codegen/:
Rscript commands.R updateplotlyjs        # bundle the latest plotly.js from npm
Rscript commands.R codegen               # regenerate validators, go_*() constructors and figure functions
Rscript -e 'roxygen2::roxygenise()'      # rebuild documentation
R CMD build . && R CMD check --as-cran plotly.core_*.tar.gz
Generated files (R/zz-gen-*.R, R/sysdata.rda) are committed and must not be edited by hand. Tests are plain R scripts in tests/.